Dashboard and monitoring
Secure the dashboard and monitor or manage jobs through its UI, API and JobMonitor.
dotnet add package Immediate.Jobs.DashboardConfigure and register the dashboard before building the application. Then map its UI and API:
using Immediate.Jobs.Dashboard;

var traceExplorer = new Uri("https://traces.example/");
var logExplorer = new Uri("https://logs.example/");

builder.Services.AddMyAppJobs()
	.ConfigureStorage(storage => storage.UseInMemory())
	.AddImmediateJobsDashboard()
	.ConfigureDashboard(options => options.AuthorizationPolicy = "operations")
	.AddTelemetryLink(
		"View execution trace",
		JobTelemetryLinkKind.Trace,
		context => context.Execution?.ExecutionTraceId is { } traceId
			? new(traceExplorer, $"trace/{traceId}")
			: null
	)
	.AddTelemetryLink(
		"View execution logs",
		JobTelemetryLinkKind.Logs,
		context => context.Execution is { } execution
			? new(logExplorer,
				$"search?jobHandle={Uri.EscapeDataString(context.Job.JobHandle.Value)}&attempt={execution.Attempt}")
			: null
	)
	.AddTelemetryLink(
		"View all retry logs",
		JobTelemetryLinkKind.Logs,
		context => context.Execution is null
			? new(logExplorer, $"search?jobHandle={Uri.EscapeDataString(context.Job.JobHandle.Value)}")
			: null
	);

var app = builder.Build();
app.MapImmediateJobsDashboard("/jobs");
Chain AddImmediateJobsDashboard from the generated jobs registration. Set dashboard options with ConfigureDashboard; the mapping call only selects the URL path. ConfigureDashboard also accepts
an OptionsBuilder<ImmediateJobsDashboardOptions> action. Use it to bind an IConfiguration section:
builder.Services.AddMyAppJobs()
	.ConfigureStorage(storage => storage.UseInMemory())
	.AddImmediateJobsDashboard()
	.ConfigureDashboard(options => options.Bind(
		builder.Configuration.GetSection("ImmediateJobs:Dashboard")));
BindConfiguration("ImmediateJobs:Dashboard") binds the same section from the configuration
registered with dependency injection. Jobs validates the settings when the host starts.
By default, every dashboard endpoint is limited to the Development environment and returns 403
elsewhere. Setting AuthorizationPolicy uses that policy instead of the environment check. For a
trusted custom development environment, you can remove the default restriction without setting a
policy:
builder.Services.AddMyAppJobs()
	.ConfigureStorage(storage => storage.UseInMemory())
	.AddImmediateJobsDashboard()
	.ConfigureDashboard(options => options.RestrictToDevelopmentEnvironment = false);

var app = builder.Build();
app.MapImmediateJobsDashboard("/jobs");
Treat the dashboard as an administrative tool because it exposes job inputs, failures, IDs and
actions that change job state. Set AuthorizationPolicy whenever the dashboard is available
outside a trusted development environment. The policy protects both the UI and API.
The UI shows queue and state totals, recent history, job details, recurring schedules, scheduler servers and batches. It also shows workflow graphs when storage supports them.
Dashboard UI
Inspect jobs
The Jobs view lists saved jobs and their current state. Select a job to see its payload and saved
attempts, newest first. Each attempt includes its state, worker, timing, trace IDs and failure text.
Failed jobs offer Retry. Scheduled jobs and delayed retries offer Run now, which moves the
same job to Pending without changing its attempt count or failure history. Jobs that have not
finished offer Cancel with a confirmation step.
Follow batch workflows
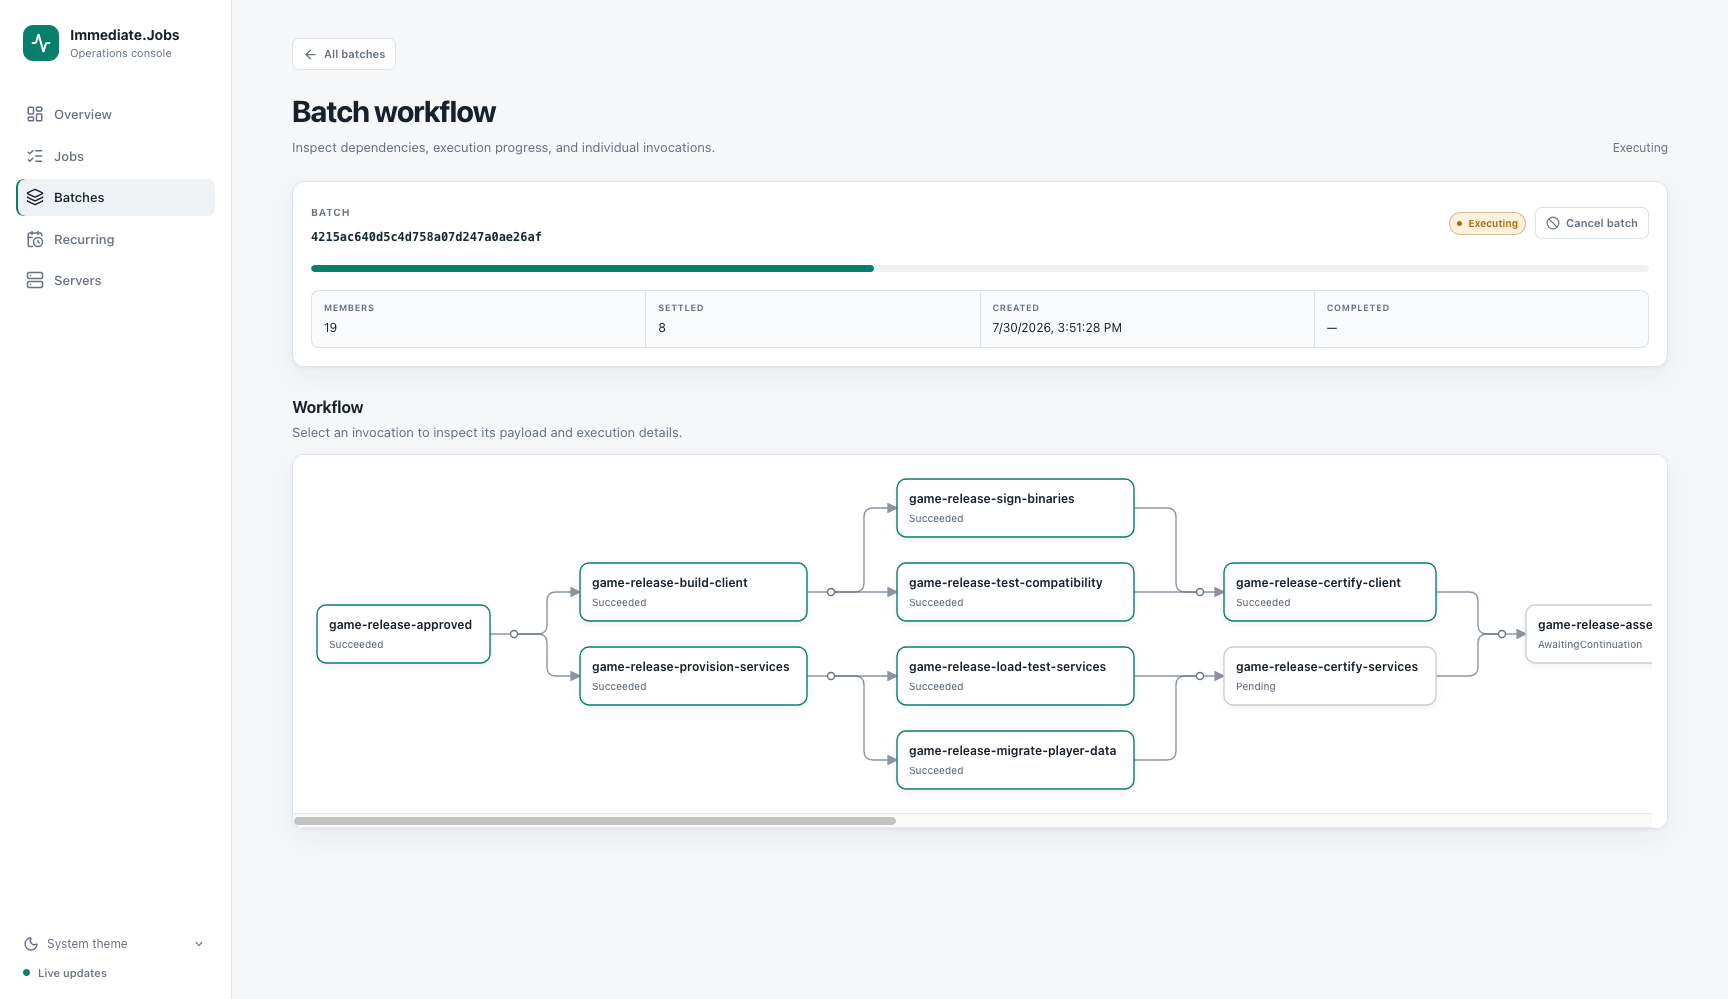
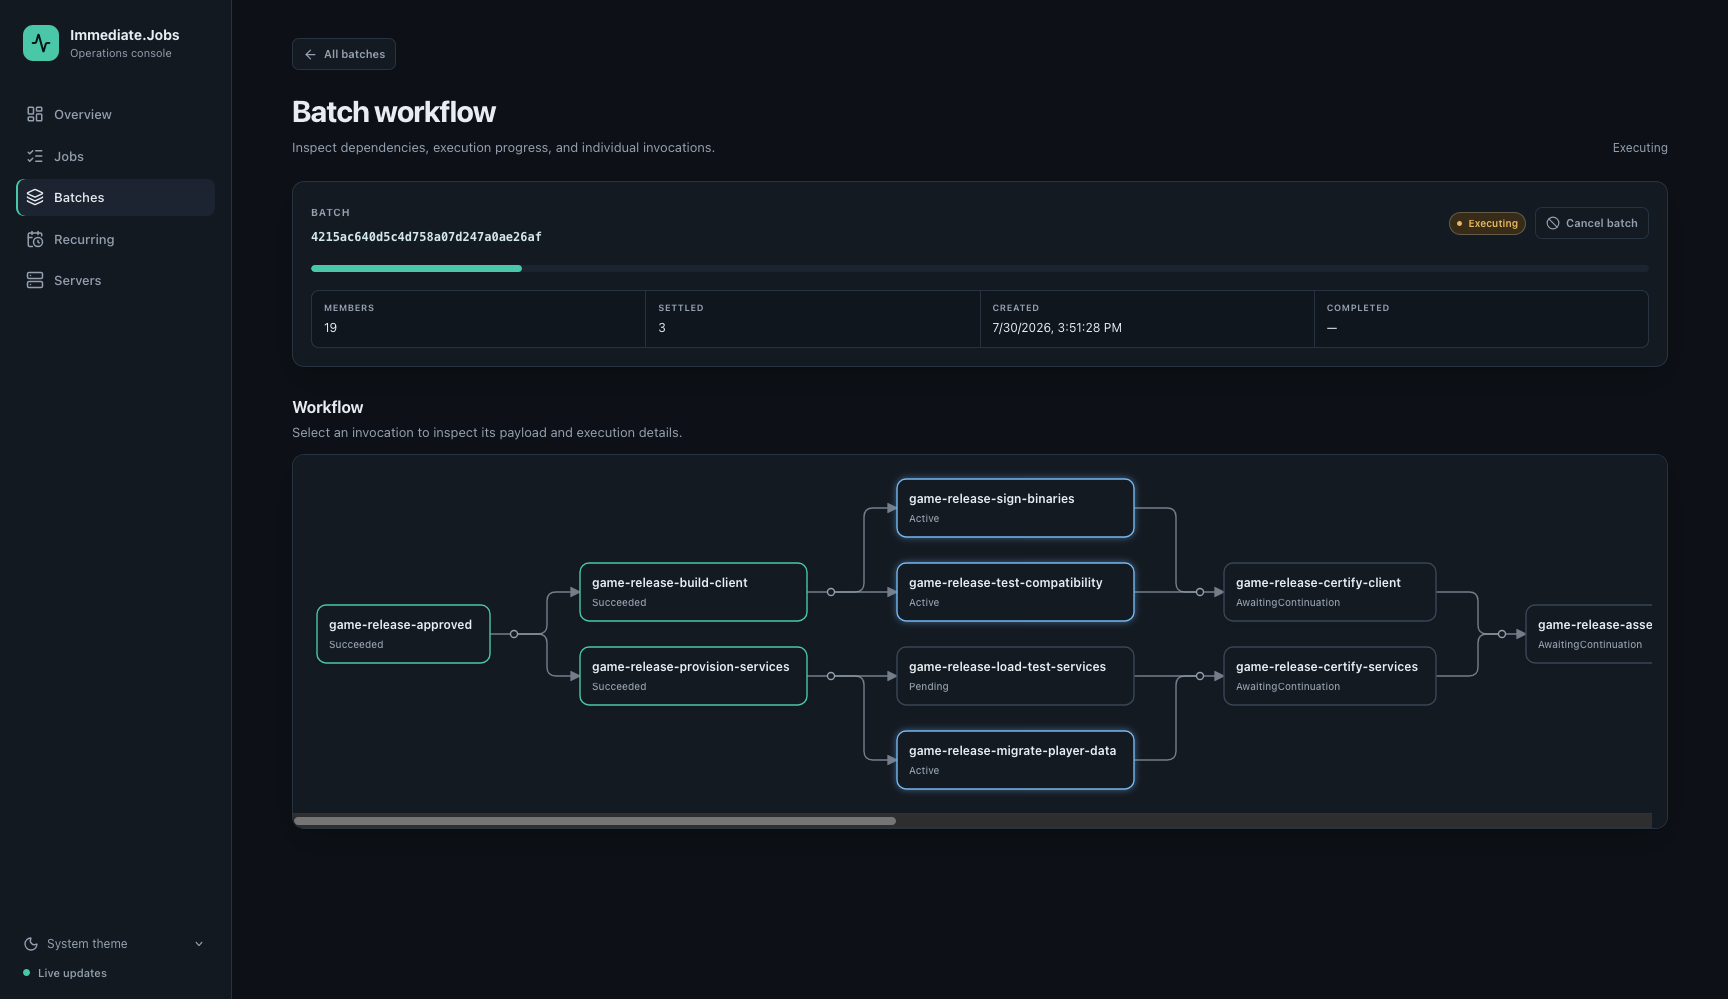
The Batches view shows the jobs in a batch and their dependencies. It distinguishes skipped branches from cancelled work. Select a job without leaving the workflow view. A running batch offers Cancel with a confirmation step.
Watch scheduler servers
The Servers view shows one card for each live scheduler node with its last heartbeat and how many
of its workers are busy. Each worker appears as a slot, so a node with many workers stays compact.
A busy slot links to the job it is running. Below the slots, the card lists each busy worker with
its job handle, attempt and start time, or shows that all workers are idle. A node drops off the
page once its heartbeat is older than its ServerTimeout.
Telemetry links
AddTelemetryLink adds application-defined links to job and execution details. For each link, the
dashboard calls your URL function with a JobTelemetryLinkContext.
| Argument | Purpose |
|---|---|
label | User-facing description of the destination. |
kind | Trace or Logs; controls how the dashboard identifies the link. |
createUrl | Builds the destination from context.Job and optional context.Execution; return null to hide it. |
For a job link, context.Execution is null and the execution fields on context.Job describe
the latest attempt. For an attempt link, context.Execution and the execution fields on context.Job both describe the selected attempt. Use Execution for links to one attempt. Use Job.JobHandle when a destination should search across every retry. Its Value property is the
raw string expected by URL builders.
The URL function may return HTTP(S) or dashboard-relative URLs. Other absolute URI schemes are
rejected. Return null before an execution trace exists or whenever a destination does not apply
to the current record.
HTTP endpoints
All paths below are relative to the mapped prefix.
Dashboard JSON names job identifiers jobHandle and batch identifiers batchHandle. Their values remain
opaque strings on the wire even though the .NET monitoring records use JobHandle and BatchHandle.
| Method and path | Purpose |
|---|---|
GET /api/overview | Current counts and supported storage features. |
GET /api/jobs | Filter by state, queue, search; skip; take 1–200 (default 50). |
GET /api/jobs/{jobHandle} | Latest saved record. |
GET /api/jobs/{jobHandle}/executions | Saved attempts newest first; skip; take 1–200 (default 50). |
GET /api/jobs/{jobHandle}/telemetry-links | Configured trace and log links for a job. |
GET /api/jobs/{jobHandle}/executions/{executionNumber}/telemetry-links | Configured links for one saved attempt. |
POST /api/jobs/{jobHandle}/cancel | Cancel a job that has not finished. |
POST /api/jobs/{jobHandle}/retry | Retry failed work or run scheduled work now. |
GET /api/recurring | Recurring schedules. |
POST /api/recurring/{name}/trigger | Start one run now. |
POST /api/recurring/{name}/pause / resume | Change schedule state. |
GET /api/servers | Live scheduler nodes with per-worker and loop status. |
GET /api/batches | Filter by state, skip, take 1–500 (default 100). |
GET /api/batches/{batchHandle} | Batch status. |
GET /api/batches/{batchHandle}/members | Filter and page through jobs in a batch. |
GET /api/batches/{batchHandle}/graph | Jobs and dependencies in a batch. |
POST /api/batches/{batchHandle}/cancel | Cancel jobs in a batch that have not finished. |
DELETE /api/batches/{batchHandle} | Delete a completed batch. |
GET /api/events | SSE state snapshots at UpdateInterval. |
GET /api/batches/{batchHandle}/stream | SSE status and graph events on change. |
Actions return these status codes:
| Status | Meaning |
|---|---|
202 | A recurring run was accepted. |
204 | A cancel, retry, pause, resume or batch action succeeded. |
400 | A route or paging value is invalid. |
404 | The item does not exist, or storage does not support the requested feature. |
409 | The item’s current state does not allow the action. |
Live endpoints use server-sent events (SSE). They send retry: 3000, disable proxy buffering and
close when the request is aborted. The server checks for changes on a timer instead of keeping an
event log, so clients should reload after reconnecting.
Use JobMonitor in code
Inject the singleton JobMonitor for custom status pages and administrative endpoints. It reads
snapshots, jobs, saved attempts, batches, batch members and workflow graphs. It can also cancel or
retry jobs, cancel or delete batches, and pause, resume or trigger recurring schedules.
The dashboard uses this same service.
IJobMonitor exposes only the read methods. Use it when code needs no management commands or a test
needs a simple replacement. Do not use IJobStorage for application monitoring or management. It
is for storage providers and the Jobs runtime.
Monitor methods accept JobHandle and BatchHandle. Scheduling calls already return those types.
At an HTTP or database boundary, convert a raw identifier with JobHandle.FromString or BatchHandle.FromString. QueryExecutionsAsync takes the job handle separately from its paging
and attempt filter.
QueryExecutionsAsync returns attempts newest first. Execution history remains with its job or
batch until that record is deleted or purged. Batch reads return null when the provider does not
support graphs, so non-batch monitoring still works with Redis and other queue-only providers.
Monitoring snapshots include only scheduler servers whose last heartbeat is within that server’s
own ServerTimeout (10 seconds by default). Each server reports its ServerTimeout, what each
worker is running, and the status of its acquisition and lease-renewal loops. SQL providers remove
stale server rows on later heartbeats, while Redis expires them. Apply
paging and authorization to custom endpoints because payload and failure data can contain
business-sensitive values.